...
This article shows one such way of monitoring server information. For this example, we attempt to determine if there is a correlation between the server JVM heap space and the web containers number of bytes downloaded. In other words, this monitoring session will show if the server is releasing heap memory after client downloads. You can create views based on your needs or just using predefined graphs and views in Geronimo 2.1.5
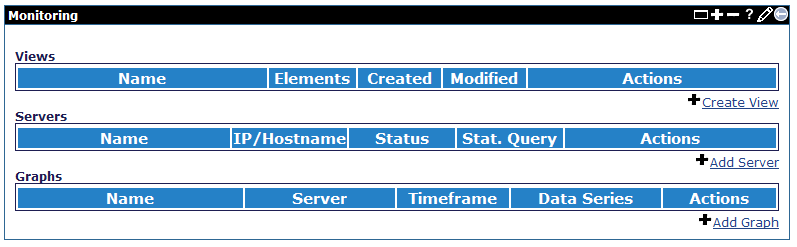
First, select the Monitoring link on the Console Navigation menu. If this is your first monitoring session, you should see an empty set of Servers, Views, and Graphs as shown in this figure.
...
Click on a view to start monitoring server information over time. This view shows the JVM heap and web server bytes sent over a one hour period. As you see in the example, the JVM heap memory goes up and down over time with little correlation to the number of bytes users request from the web server.

Monitoring the server with predefined graphs and views
Geronimo v2.1.5 provides a set of predefined graphs and views for server monitoring. With the enhancement, a view-only user monitor is created and the user can leverage those graphs and views directly to monitor the health of a server. See Monitoring the server with predefined graphs and views for the details.