...
First, select the Monitoring link on the Console Navigation menu. If this is your first monitoring session, you should see an empty set of Servers, Views, and Graphs as shown in this figure.

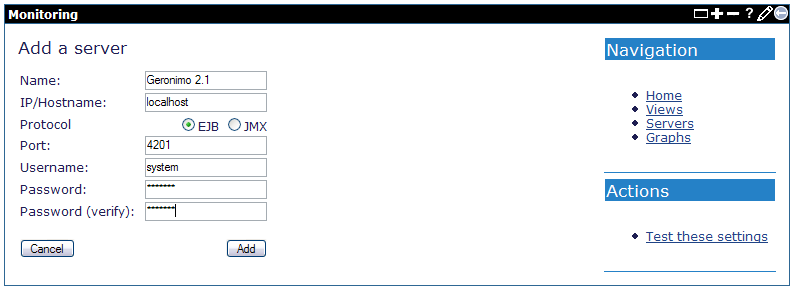
Adding a Server
Select a server to monitor by providing a host name or IP address. Select the protocol for communication and any security credentials. Save this server definition by pressing Save.
Adding a Graph
Select information to display by adding a graph. Select the server you are monitoring, and then choose an MBean that publishes server information by choosing an MBean from the MBean drop down control. Once you have selected an MBean, you can see what information is available by selecting data from the Data series drop down control. When you have described the data, save this graph by pressing Save.

Select more information to display by adding a second graph. As the two data series scroll in time, we will be able to detect any correlation between the data. Once again, choose a server and an MBean to monitor. Select data from the Data series drop down control. Since data sent increases over time, also select delta for the Data series, so we see the rise and fall of the data over time. Save this graph by pressing Save.

Adding a View
Now group one or more graphs into a view. Here we add a view for "JVM vs Bytes Sent" by selecting two of the graphs we created in earlier steps. Save the view by pressing Save.

This figure shows the console monitoring portlet after we have added the server, graphs, and views.

The Monitoring Graph View
Click on a view to start monitoring server information over time. This view shows the JVM heap and web server bytes sent over a one hour period. As you see in the example, the JVM heap memory goes up and down over time with little correlation to the number of bytes users request from the web server.
