Introduction and Scope
At Netflix, we have a homegrown tracing solution based on the Dapper paper and is used to trace the RPC calls in microservices that are part of the control plane in video streaming. We are gradually replacing that with a Zipkin based solution and enhance it further to suit our requirements. The distributed tracing is owned by the Insight Engineering team and we partner with many platform teams for instrumentation, databases and stream processing.
Most of our microservices are developed in Java and we may support tracing for other languages in the future.
As of 10-2018, we are using Kafka and Flink to transport data into Elasticsearch and S3 storage. The data in Elasticsearch is visualized using the OSS Zipkin UI and we have also developed an internal API to allow listing unique tag values and expose the service dependency graph data. The data in S3 is queryable via Iceberg table format.
System Overview
Instrumentation: Because we are gradually replacing the homegrown solution with Zipkin, we have a mix of homegrown and native Zipkin instrumentation. The homegrown tracing library data model is similar to that of Zipkin but emits events instead of spans. The newer runtime, which is Spring based, emits native Zipkin spans. We convert the trace events to Zipkin spans in the backend at the time of ingestion and stitch it with native Zipkin spans. Tracing instrumentation is supported in Jersey and Spring Boot based runtimes. We do instrument gRPC calls, REST calls, EVcache client and Hystrix library. The FIT (Failure Injection Testing) library is instrumented to add FIT session information to a trace.
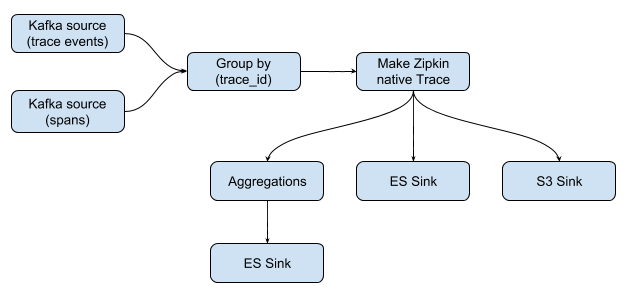
Data ingestion: Our homegrown trace client library and the Spring apps publishes trace events in JSON format to Kafka. Spring apps uses Spring Sleuth http exporter to publish the spans to a Http endpoint and this Http publisher forwards the spans to Kafka. This allows the client to be thin and also enables the publisher to perform any filtering or routing necessary. Sampling decision is made in the API gateway service - Zuul - and is set to trace 0.1% of the requests. 100% of requests are sampled for any FIT experiments if enabled. The messages are read off Kafka by a Flink job to perform real-time analytics. The output of any real-time analytics and the raw spans are inserted to Elasticsearch. The data is also uploaded to S3. In the Flink job, the incoming events or native Zipkin spans are first grouped by `trace_id` prior to performing any analysis. The record in S3 is a complete trace and not individual spans.
Data store and aggregation: The trace data is stored in Elasticsearch and S3. Data in Elasticsearch is retained for 15 days and in S3 for 90 days. Data in Elasticsearch is used for looking up individual traces and performing span level aggregation queries like listing out distinct tag values for a given filter criteria. The data in S3 is used for data mining use cases, like performing diff on two populations of traces. The data in S3 is queryable via a Iceberg table.
Realtime and batch analysis: Service dependency analysis is performed real-time in the Flink job. The output aggregate is written to Elasticsearch every 15 mins.
Goals
What near-, mid- and long-term milestones exist? Near-term milestone is to retire our homegrown tracing system and replace it with the Zipkin based solution. The long term vision is to have the mechanism to start tracing at any level in the call graph, support higher sampling rates, rule-based sampling strategies and gradually shape the analytics offerings depending upon the use cases.
What value is the business looking to receive? The business value is in providing operational visibility into the systems and enhance developer productivity. To this effect, various teams leverage the tracing data directly or indirectly via the APIs.
What improvements are you looking to further?
We would like to improve our instrumentation portfolio and add tracing support for more libraries and runtimes based upon the requirements.
On the analytics front, engage closely with the users to understand their pain points and modify the product to suit their need.
Enhance the architecture to meet the scale requirements at the time.
There is scope further to provide a self service way of collecting and performing analysis on the tracing data for a service owner.
What other projects relate to your tracing goals? The user teams listed earlier develop their systems using the trace data directly or indirectly via the API.
Current Status (10-2018)
Data ingestion rate: At a very low sampling rate, all regions combined, at peak we see 240 MB/sec network in to Kafka.
Elasticsearch: 90 nodes running version 5.4.1. The daily index size is about 5TB/day.
Flink: 48 Task manager nodes.
Fig 1: Architecture
Fig 2: Flink job stages

