_ _
JMeter Performance evolution across versions (
...
>= 2.5.1)
This article is the record of a Test done in the following conditions:
...
Test Plan:
Test Plan used :
TestPlan
JMETER 2.5.1
Transactions:
![]()
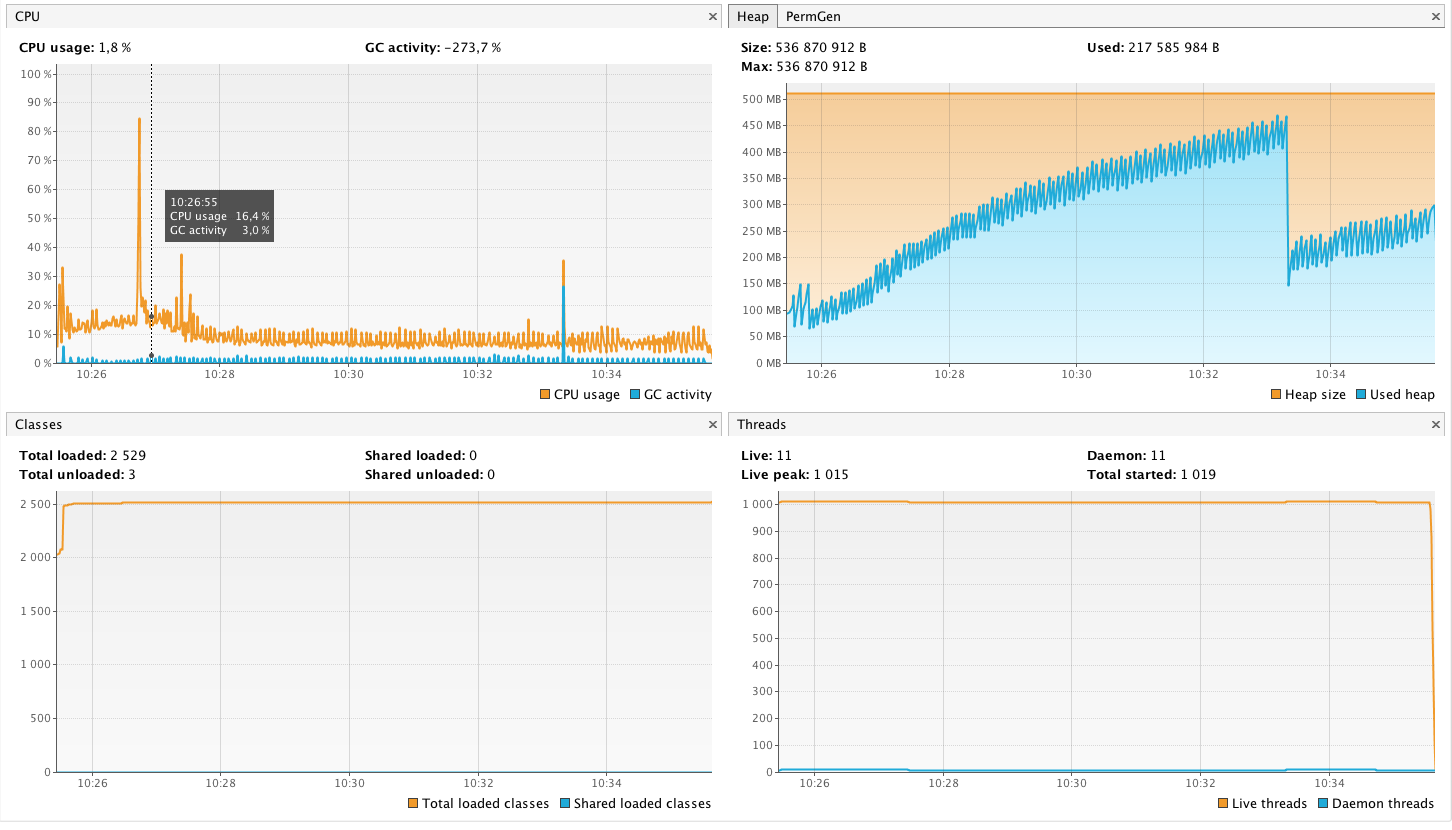
JVM Behaviour:
...
- GC activity is much higher with around 5 GC CPU peaks every 2 minutes
- and 20 FULL GC of 700 to 800 ms each
- Throughput: 97,71%
- Pauses : 13,69s
- Memory Cleaned : 391m/min
- Full GC tend to be much more frequent at end of test
JMETER 2.6:
Transactions:
![]()
JVM Behaviour:
JMETER 2.7:
Transactions:
![]()
JVM Behaviour:

GC Activity:
- No GC CPU peak,
- 1 FULL GC
- Throughput:98.54
- Pauses : 8.9s
- Memory cleaned: 1108m /min
...