...
One of the primary goals in developing the monitoring and management plugin was to allow an administrator to monitor any exposed component on any Geronimo server. This meant that the customization must be easy.
DataSources
The datasources used to communicate to the DB on the server and client side are all packaged into separate plugins. By default, the provided datasources are used to connect an Apache Derby database (the reason for this is because the default DB that Geronimo uses is also Derby). However, since these datasources are packaged as plugins, anyone is able to write their own datasource deployment descriptor, package it into a plugin, and use it instead of the one provided by default.
You can learn how to configure your own datasources here.
Servers
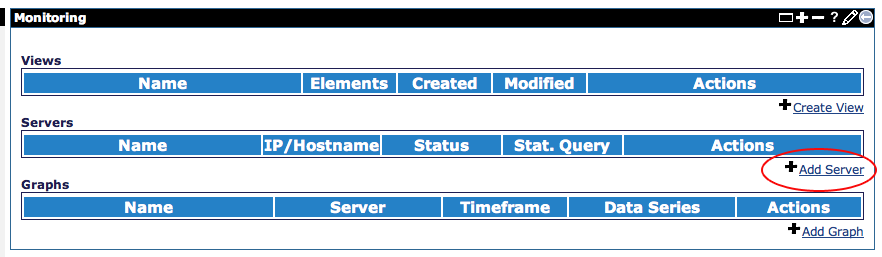
To begin monitoring after the monitoring console has been installed, it is necessary to first add a server. This is done by first selecting the monitoring console from under the 'Server' category in the Geronimo administrative console.
Once in the monitoring console, simply select the 'Add Server' link under the servers category.
In the Server Add form, fill in the necessary information about the server that is being added as follows and click 'Add'.
Alternatively, it is possible to test the connection using the information provided via the 'Test these settings' link on the right navigation pane.

After a server is successfully added, the browser will be redirected to the main monitoring console page, again listing all Views, Servers, and Graphs configured on the console.
If configuring monitoring on a freshly deployed instance of the monitoring agent, it is necessary to click the 'Enable Query' link associated with the added server, which will enable snapshot collection on the default duration of 5 minutes.
Once the Snapshot querying has been enabled, the monitoring agent will immediately begin taking statistics snapshots on the default interval of 5 minutes. This can be changed by selecting the 'Edit' link associated with the server, otherwise particular statistics being collected can be viewed or changed by selecting the server name.

When viewing a server, information such as Status (Online/Offline), Snapshot Thread (running or not), Timestamp for added/last seen/modified, address, Snapshot Duration, and snapshot Retention will be visible.
In addition to this, the bulk of the page is consumed by detailed information on all statistics being monitored by the monitoring agent. Clicking on one of the statistic names will result in a redirection to a graph add page to generate a graph based on that statistic with much if the information already populated.
With the Xs and +s on the right pane of the page, it is possible to either disable or enable (respectively) statistics collection for given MBean.

Monitored MBeans
Graphs
Administrators using the console are able to create customized graphs. They are able to specify which statistic to be on which axis, in addition to the ability to perform a mathematical operation on two statistics.
...