...
X and Y axis labels, as well as the description and name must be manually defined.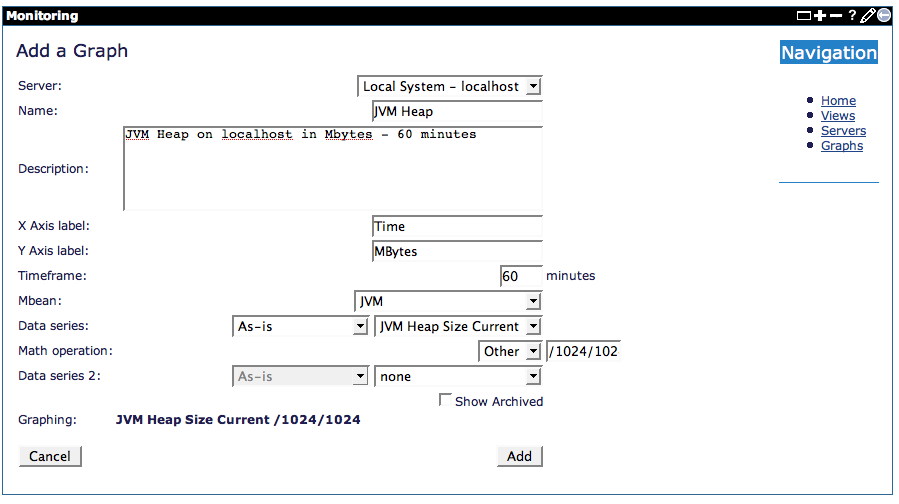
Once all of this information is provided, simply click 'Add' to add the graph to the database.
After the graph is added, the browser will be redirected to the main monitoring console page, where selecting the name of the graph will open a pop-up window displaying the graph as follows:

...