...
What is it?
The Geronimo monitoring plug-in is broken down between server and client plug-ins, referred to as the 'Agent' and 'Console' respectively. When properly setup, these plug-ins provide both local and remote real-time JSR77 compliant statistic monitoring, as well as historical tracking of any exposed statistic with visual representations drawn in the form of graphs through the Dojo Toolkit's dojoX Charting packages.
...
While the EJB Agent is the default plug-in installed with the full JEE5 Java EE 5 assembly of Geronimo, the JMX is recommended for those that otherwise would require no form of EJB in their assembly but still require monitoring ability.
...
In the Plugins portlet:
- Click 'Update repository list'
- Select a valid Geronimo repository from the list available
- Click 'Show Plugins in selected repository'
- To install the Monitoring Agent, select the appropriate plug-in from the list shown
- If the OpenEJB component is not already present on the assembly, it may be beneficial to use the JMX flavor of the Monitoring Agent
- To install the Monitoring Console, select the plugin appropriate for the web container in use from the list shown
- If the goal is to both view and record statistics from the same instance of Geronimo, both the Agent and Console plugins must be installed
...
To begin monitoring after the monitoring console has been installed, it is necessary to first add a server. This is done by first selecting the monitoring console from under the 'Server' category in the Geronimo administrative console.
Once in the monitoring console, simply select the 'Add Server' link under the servers category.
...
In the Server Add form, fill in the necessary information about the server that is being added as follows and click Add. For example:
- Name=Local System
- IP/Hostname=localhost
- Protocol=[EJB/JMX] (The JMX protocol requires a plugin named
agent-car-jmxmust be installed and started.) - Port=[4201/1099] (4201 for EJB and 1099 for JMX.)
- Username=system
- Password=manager
- Password(verify)=manager
'Add'.
Alternatively, it is possible to test the connection using the information provided via the 'Test these settings' link on the right navigation pane.
...
After a server is successfully added, the browser will be redirected to the main monitoring console page, again listing all Views, Servers, and Graphs configured on the console.
If configuring monitoring on a freshly deployed instance of the monitoring agent, it is necessary to click the 'Enable Query' link associated with the added server, which will enable snapshot collection on the default duration of 5 minutes.

Once the Snapshot querying has been enabled, the monitoring agent will immediately begin taking statistics snapshots on the default interval of 5 minutes. This can be changed by selecting the 'Edit' link associated with the server, otherwise particular statistics being collected can be viewed or changed by selecting the server name.

When viewing a server, information such as Status (Online/Offline), Snapshot Thread (running or not), Timestamp for added/last seen/modified, address, Snapshot Duration, and snapshot Retention will be visible.
In addition to this, the bulk of the page is consumed by detailed information on all statistics being monitored by the monitoring agent. Clicking on one of the statistic names will result in a redirection to a graph add page to generate a graph based on that statistic with much if the information already populated.
With the Xs and +s on the right pane of the page, it is possible to either disable or enable (respectively) statistics collection for given MBean.

...
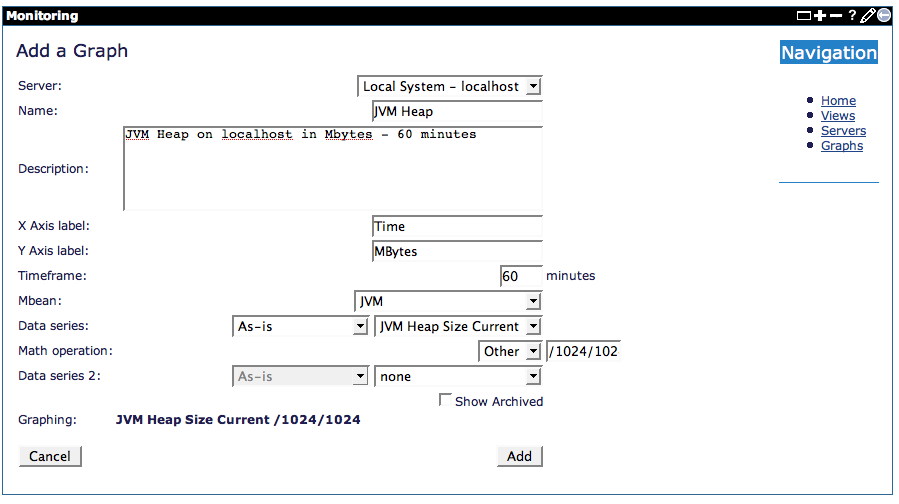
X and Y axis labels, as well as the description and name must be manually defined.
Once all of this information is provided, simply click 'Add' to add the graph to the database.
After the graph is added, the browser will be redirected to the main monitoring console page, where selecting the name of the graph will open a pop-up window displaying the graph as follows:

...
To add a view, simply select the 'Create View' link from the monitoring console main page. This will open a form that requires providing a View name, description as well as checking the boxes next to the graphs desired to be incorporated in this view.
Once complete, simply click save to add the view to the database.
Displaying the view will show all graphs currently in the view on a single page, as well as automatically refresh every 5 minutes.
