| The is available since v6.0.0 |
Metrics are disable by default. The gathering of metrics as well as exposing them via HTTP for analysis needs to be enabled first.
Comment in the following block in the openmeetings/WEB-INF/web.xml
<!-- Start Prometheus Filter HTTP Servlet metrics <filter> <filter-name>prometheusFilter</filter-name> <filter-class>io.prometheus.client.filter.MetricsFilter</filter-class> <init-param> <param-name>metric-name</param-name> <param-value>webapp_metrics_filter</param-value> </init-param> <init-param> <param-name>help</param-name> <param-value>This is the help for your metrics filter</param-value> </init-param> <init-param> <param-name>buckets</param-name> <param-value>0.005,0.01,0.025,0.05,0.075,0.1,0.25,0.5,0.75,1,2.5,5,7.5,10</param-value> </init-param> <init-param> <param-name>path-components</param-name> <param-value>0</param-value> </init-param> </filter> <filter-mapping> <filter-name>prometheusFilter</filter-name> <url-pattern>/*</url-pattern> </filter-mapping> End Prometheus --> |
To enable the export of the metrics as well as some generic Tomcat export (for example around active threads) you need to comment in the following block in openmeetings/WEB-INF/web.xml
<!-- Start Prometheus export metrics HTTP <servlet> <servlet-name>metrics</servlet-name> <servlet-class>org.apache.openmeetings.web.util.logging.OpenMeetingsMetricsServlet</servlet-class> </servlet> <servlet-mapping> <servlet-name>metrics</servlet-name> <url-pattern>/services/metrics/</url-pattern> </servlet-mapping> End Prometheus --> |
This will expose the metrics at: http://$HOST:$PORT/openmeetings/services/metrics/ (be aware of the trailing "/" !)
If you plan to use this in production you need to secure that endpoint. For example by:
|
In order to get insights on the application specific logic and streaming relevant components you need to additionally enable certain annotations by commenting in openmeetings/WEB-INF/classes/applicationContext.xml
<!-- Start annotation Prometheus metrics <aop:aspectj-autoproxy/> End annotation --> |
Above will enable an endpoint to publish the metrics as HTTP endpoint. You can then use Prometheus (or other tools) to read it in and graph it.
Easiest is to point to it via a Prometheus that runs in a docker container. How to startup the docker container:
docker run --rm -it -p 9090:9090 -v /Users/Sebastian.wagner/Documents/mywork/openmeetings/_REPO/copy-files/ :/etc/prometheus/prometheus.yml prom/prometheus |
Example local-prometheus.yml file to reference in above docker command (points to local running OpenMeetings instance)
global:
  scrape_interval:     15s # By default, scrape targets every 15 seconds.
  evaluation_interval: 15s # Evaluate rules every 15 seconds.

  # Attach these extra labels to all timeseries collected by this Prometheus instance.
  external_labels:
    monitor: 'scalyr-blog'

rule_files:
  - 'prometheus.rules.yml'

scrape_configs:
  - job_name: 'prometheus'

    # Override the global default and scrape targets from this job every 5 seconds.
    scrape_interval: 5s

    static_configs:
      - targets: ['localhost:9090']

  - job_name:       'openmeetings-local'

    # Override the global default and scrape targets from this job every 5 seconds.
    scrape_interval: 5s

    metrics_path:  'openmeetings/services/metrics/'

    static_configs:
      - targets: ['192.168.1.66:5080']
        labels:
          group: 'production'
|
Change 192.168.1.66:5080 to your local running OpenMeetings instance. Below graphs and queries are done using this docker container.
Majority of the metrics collected (specially the below ones) are of the Prometheus type "histogram" https://prometheus.io/docs/practices/histograms/
A histogram automatically both:
Initially you may find it's not quite trivial to calculate the duration for individual calls. But it makes sense once you review below. What we are interested is "rate per min" and similar statistics. Not an individual call, but rate/average over a certain period of time.
There are roughly 4 categories of Metrics enabled in OpenMeetings
Basic Tomcat generics see: /openmeetings-web/src/main/java/org/apache/openmeetings/web/util/logging/TomcatGenericExports.java


All Servlet calls, including the WebService calls are available automatically in Prometheus. They are collected by a ServletFilter and published as metrics.
Once collected in Prometheus you can filter all statistics and run queries on long running or size.
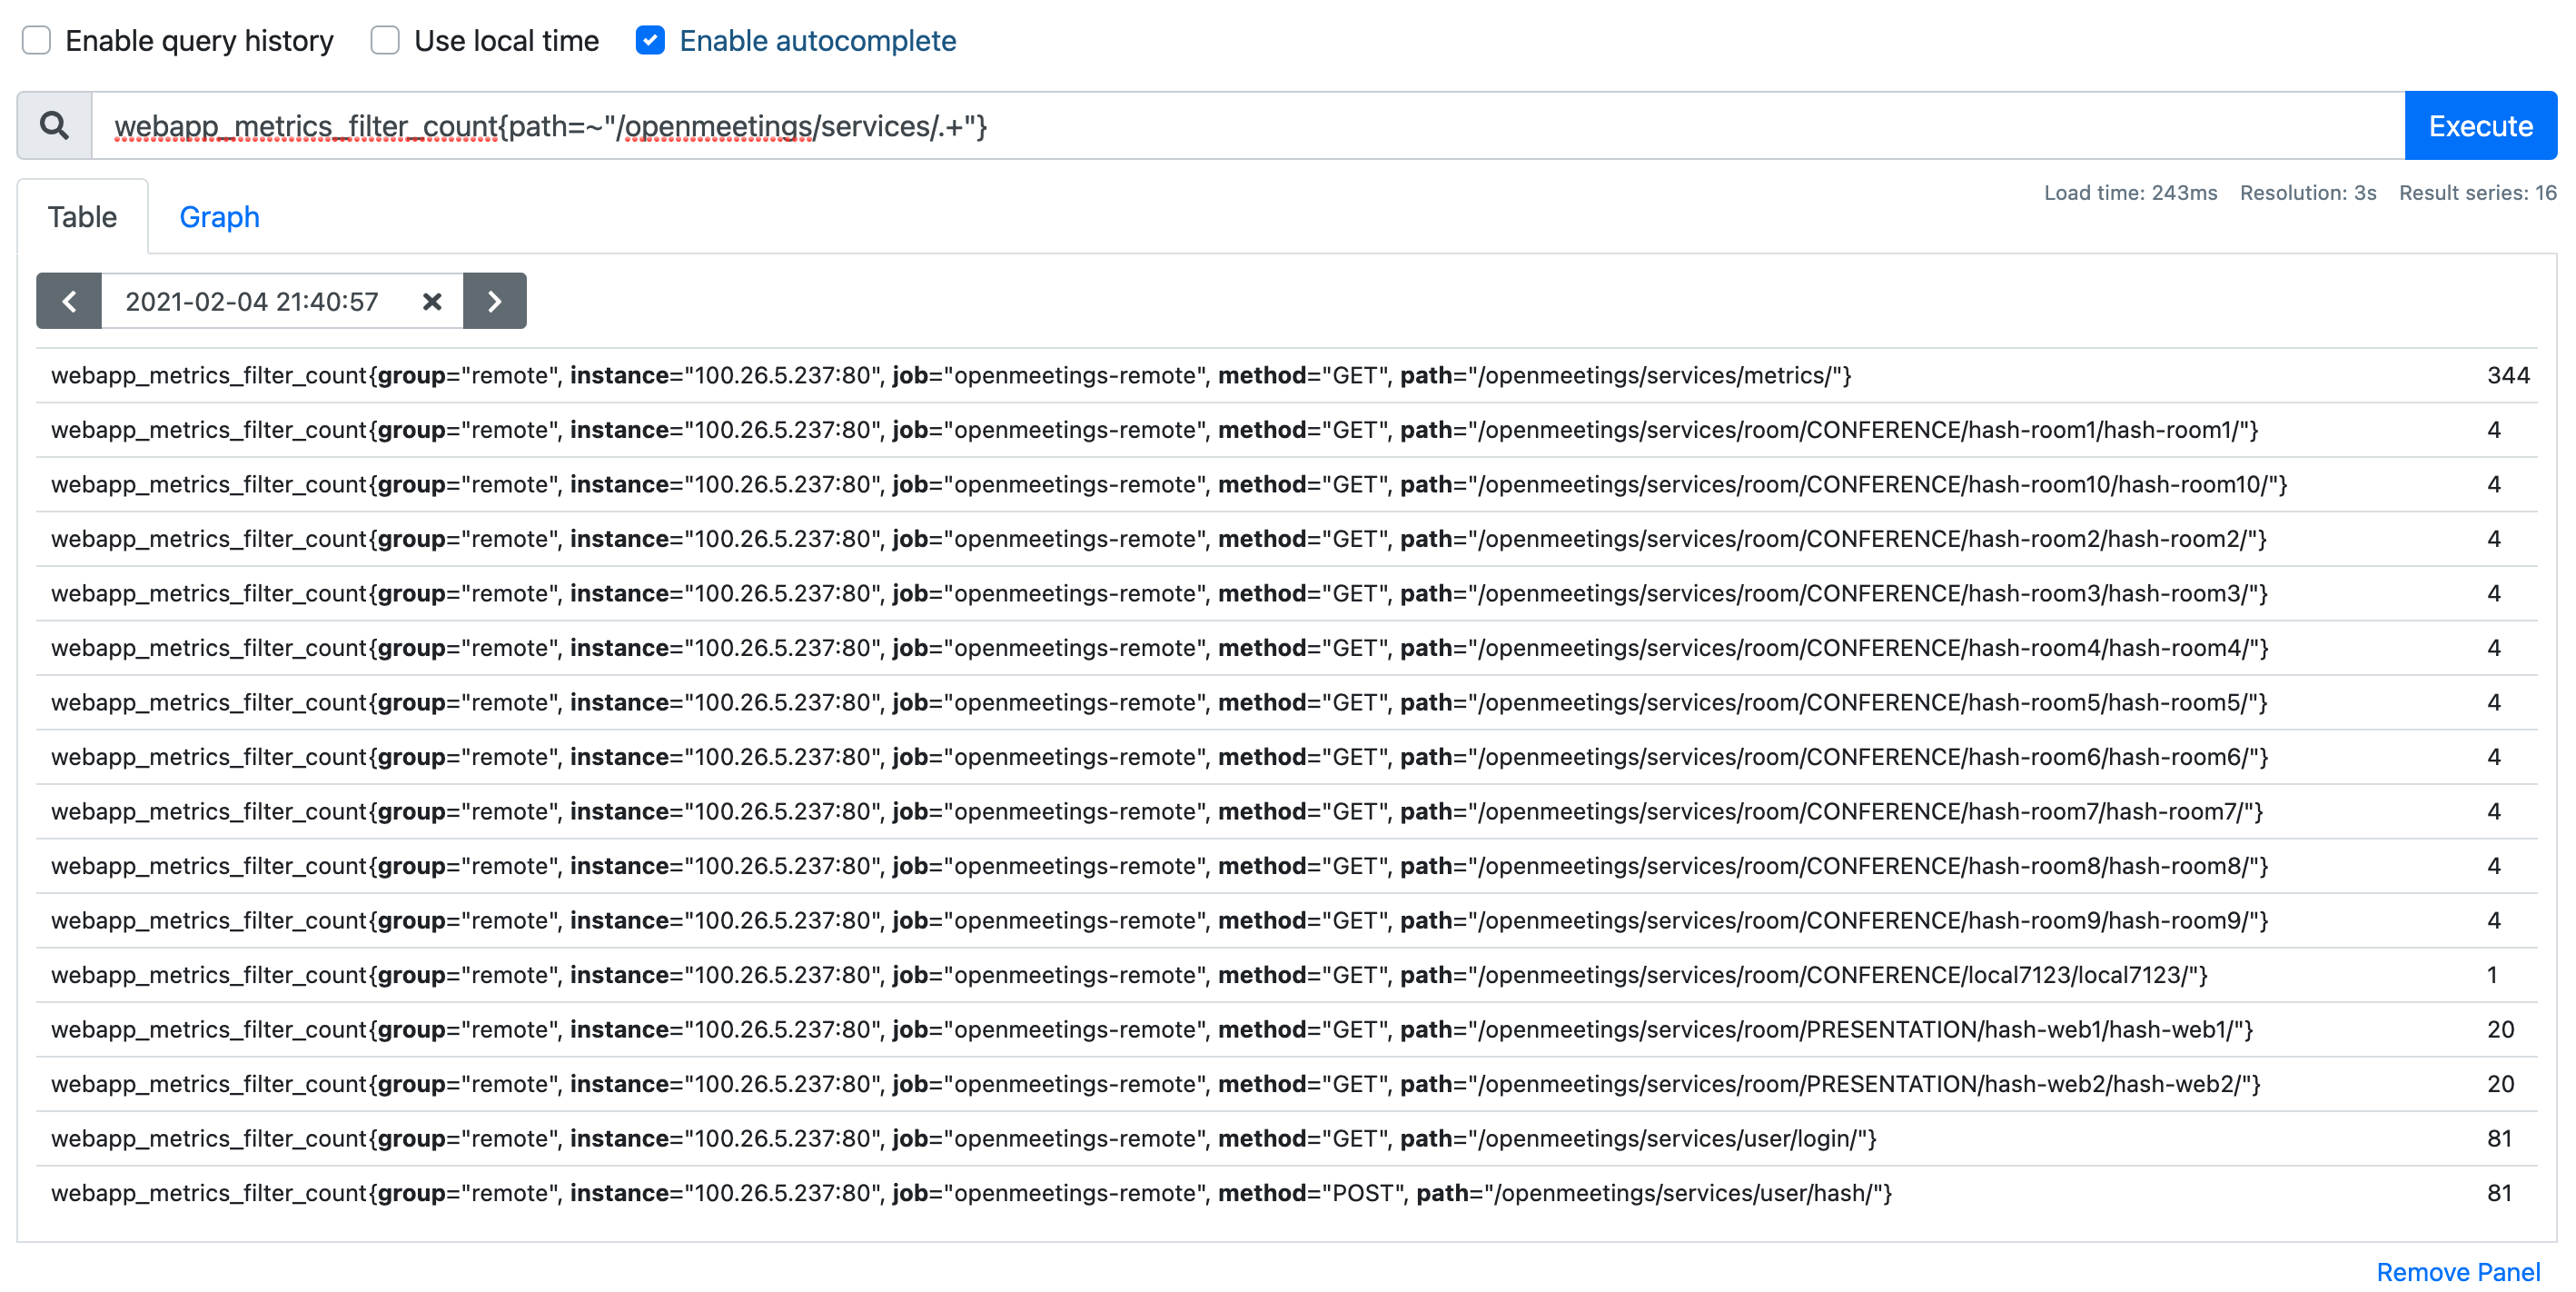
Below query returns the total count of all calls using the query (below uses the wildcard on the path attribute to filter web service calls out, you could filter further if required)
webapp_metrics_filter_count{path=~"/openmeetings/services/.+"} |

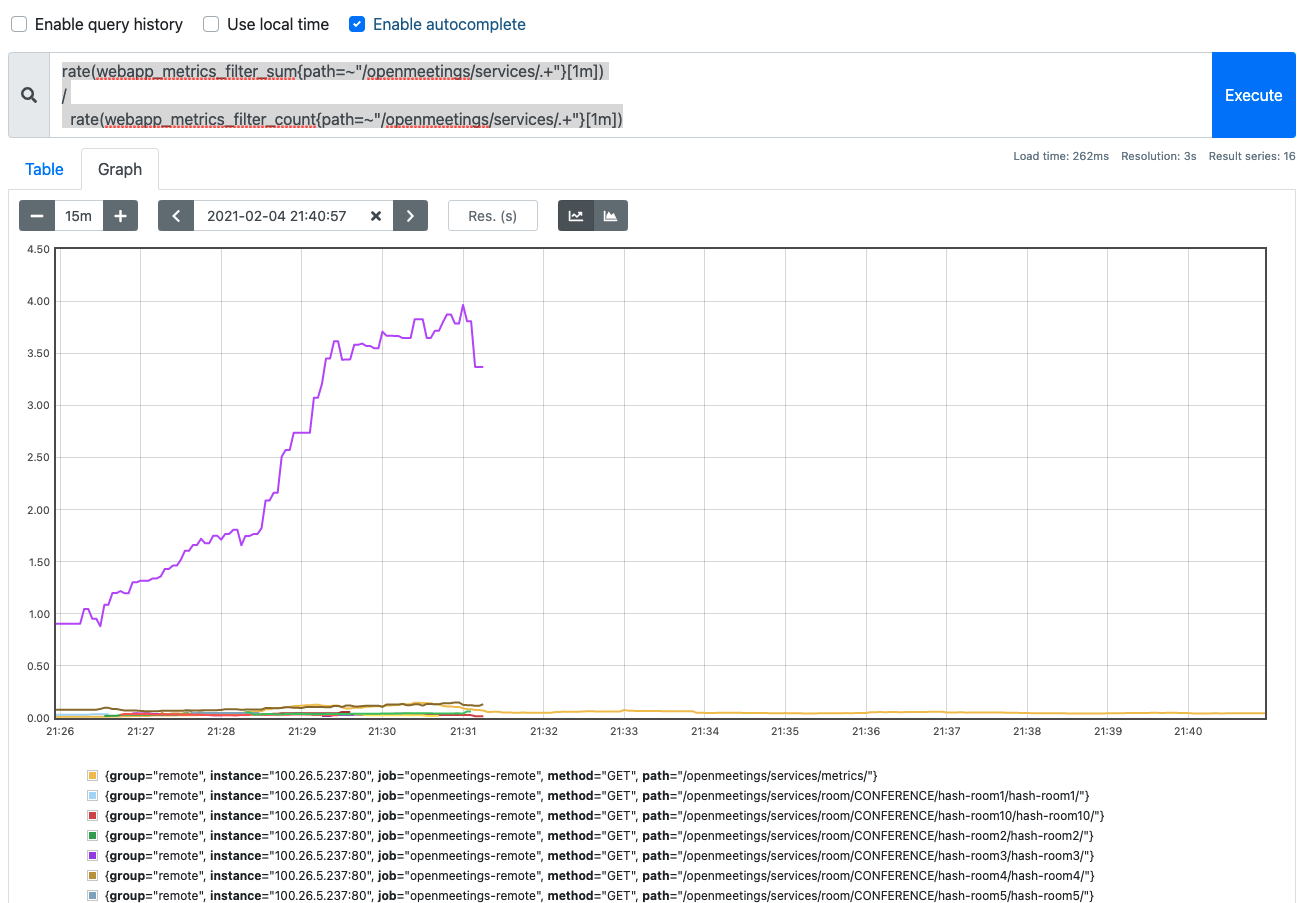
In order to get the duration for those calls you would take the sum (by a certain time period) divided by the count (by the same time period) and what you would get is:
Average duration within a 1min time window, for each of the calls => and graph is and you can adjust the time window also
rate(webapp_metrics_filter_sum{path=~"/openmeetings/services/.+"}[1m])
/
rate(webapp_metrics_filter_count{path=~"/openmeetings/services/.+"}[1m]) |

For Spring Beans I've added an annotation that uses spring-aop to inject bytecode/intercept the start and end of the method (see: /openmeetings-util/src/main/java/org/apache/openmeetings/util/logging/PrometheusAspect.java)
So for any Spring Bean, you can just annotate the method with the 2 annotations I created:
I created two, cause that way you can filter them and measure database queries. (There would be a way to use JDBC interceptors, but it's quite complicated with openJPA).
See for example some annotated methods in UserDao: /openmeetings-db/src/main/java/org/apache/openmeetings/db/dao/user/UserDao.java#L626
| However this method only works if the relevant method is in a Spring Bean. |
| rate(org_openmeetings_metrics_sum{type="database"}[1m]) / rate(org_openmeetings_metrics_count{type="database"}[1m]) |

You can select different ones via the legend on the bottom.
rate(org_openmeetings_metrics_sum{type="application"}[1m])
/
rate(org_openmeetings_metrics_count{type="application"}[1m]) |

This metric is currently not in use since it can't be disabled |
Unfortunate not all places in the code are spring beans. Also sometimes we have inner classes or similar issues.
In that case I've added a Util that you can add at the start and end of the Method invocation, to create another metric.
At the start
		Histogram.Timer timer = PrometheusUtil.getHistogram() //
				.labels("RoomPanel", "onInitialize", "application").startTimer();
try { |
At the end
		} finally {
			timer.observeDuration();
} |
rate(org_openmeetings_metrics_sum{type="application",class="RoomPanel",method="onInitialize"}[1m])
/
rate(org_openmeetings_metrics_count{type="application",class="RoomPanel",method="onInitialize"}[1m]) |
