Tracer Example
Introduction
This example demonstrates the Tracer. Tracer is a tracing feature build in camel core to log snapshots of Exchanges while they are routed. This allows you to see:
- how a given Exchange was routed
- a snapshot of the content of the Exchange at any given node it passed in the route
When used Camel will by default log the snapshot at INFO level. This example demonstrates how to persist trace snapshots using JPA into a database. This allows you to store this information and query them from a SQL prompt, giving you full power to analyze the data.
Requirements
This requires Camel 2.0, the camel-jpa component and configuration of the target database.
Data Model
Camel uses the org.apache.camel.processor.interceptor.JpaTraceEventMessage JPA @Entity as data model.
This class has been enhanced with JPA annotations.
The class has the following properties in the JPA model:
Property |
Type |
Description |
|---|---|---|
Id |
Long |
Primary key that is generated by the database |
Timestamp |
Date |
Timestamp when the snapshot was generated. Is the system time of the JMV in which Camel is running |
FromEndpoint |
String |
the URI of the starting consumer the Exchange was created (usually a from in the route). |
PreviousNode |
String |
id of the previous step in the route. Is |
ToNode |
String |
id of the next step in the route |
ExchangeId |
String |
unique id of the Exchange |
ShortExchangeId |
String |
id of the Exchange without the machine name |
ExchangePattern |
String |
The Exchange Pattern such as InOnly or InOut |
Properties |
String |
The Exchange properties dumped as a String |
Headers |
String |
The Exchange IN headers dumped as a String |
Body |
String |
The Exchange IN body dumped as a String |
BodyType |
String |
The Exchange IN body java type such as String, org.w3c.Document, com.mycompany.MyOrder etc. |
OutHeaders |
String |
The Exchange OUT (if any) headers dumped as a String |
OutBody |
String |
The Exchange OUT body (if any) dumped as a String |
OutBodyType |
String |
The Exchange OUT body (if any) java type such as String, org.w3c.Document, com.mycompany.MyOrder etc. |
CausedByException |
String |
The Exchange exception (if any) dumped as a String including stacktrace |
The table name for persisting trace events is: CAMEL_MESSAGETRACED
Configuration of the database
The Tracer uses standard JPA configuration for setting the database. In the META-INF/persistence.xml file we setup the service unit and the database configuration as:
What is important is to add the JpaTraceEventMessage as a class in the persistence.xml file to register our data model:
<class>org.apache.camel.processor.interceptor.JpaTraceEventMessage</class>
In this example we use Hibernate JPA and a HSQLDB as database.
Running the example
The README.txt states how to run the example from either ANT or Maven.
Here we show running with Maven:
mvn camel:run
When the application starts it start:
- in the console
- a GUI for browsing the SQL database
Select the console where the application should prompt you to enter some words. Try entering: Camel
The application should respond with a text quote.
You can also enter multiple quotes separate with space, and the response should be the best quote based on the list of words given.
See the file src/main/resources/META-INF/spring/camel-context.xml to give you an idea how it works.
You can enter: Camel Beer and it should be smart enough to find a quote for the beer ![]()
Seeing the trace events
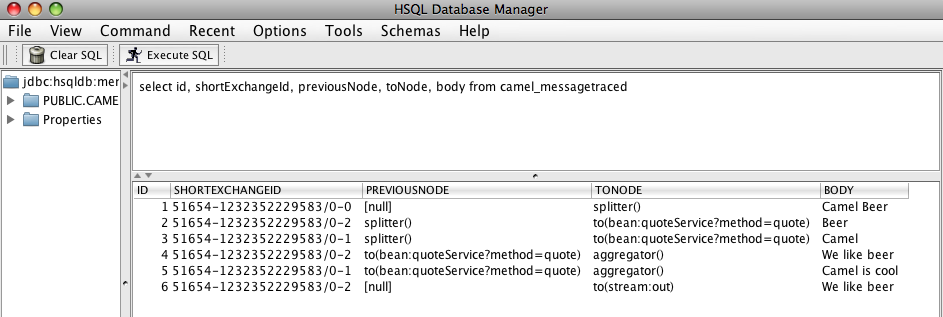
When the program was started a GUI application was started as well. Its a SQL prompt for the database. So try entering:
select * from camel_messagetraced
And it should return the list of trace events in the SQL.
We enter this sql: select id, shortExchangeId, previousNode, toNode, body from camel_messagetraced and get the output as the picture below:
Routing
The diagram below illustrates the route diagram generated using Visualization.
We receive an Exchange from the in stream, then its split using the splitWords method. Then the quote method is invoked before its aggregated and finally sent to the stream out to be printed in the console.
If we look at the 6 rows from the traced SQL and with the route diagram in mind we can get a better understand how the Exchange was routed.
1. The Exchange does not have a previousNode so its the first step where its consumed from the input stream
2.
TODO