Overview
Currently, there is not a good way of surfacing Geronimo's server information so that an administrator can monitor the server's status. The architecture of using MBeans is established, but not fully exploited. This enhancement will take advantage of what Geronimo currently offers and extend it so that a server can tap into a cluster of servers and extract information from specific Geronimo servers or even aggregates of Geronimo servers.
The goal is to have at least one machine be able to reach out to all Geronimo servers in order to fetch data or even alter their state. This will be especially useful in the case of someone having to monitor a large number of Geronimo servers.
How it works (proposed)
As part of the design, there are five major components.
Management Node(s): An instance of Geronimo that has sole purpose of managing and viewing information from Server Nodes, must include admin console.
Management Plugin: Will reside on all Management Nodes and will handle the connection to the Remote Control Plugin to pull relevant information and control the machine.
Connection Information DB: Resides on either a Management Node or a different database server, has Server Name, IP:Port information and JMX Authentication information for all Server Nodes. Management Nodes use this information to connect to the Server Nodes
Server Node(s): An instance of Geronimo that runs as usual, can be Little G with our MBean and anywhere up from there.
Remote Control Plugin: Will be present on all Server Nodes, handle JSR-77 statistics collection, control the thread which takes snapshots of the server's current state.
The proposed solution would incorporate a scalable design, using the same methods to keep track of statistics and read them locally that it would be pulling them remotely from N machines. This is accomplished by creating a centralized MBean (Remote Control Plugin) that will work to be a tie-in point for all the statistics, taking a 'snapshot' of the current state of things every X minutes and recording in a database or XML file for a predetermined amount of time before there is rollover. With this MBean serving as a relay point for this data, we can simply connect to it via JMX through the Management Plugin, or a different remote machine (i.e. a proposed 'management node') to pull the information, as well as gain control over functions such as simple start/stop/restart, or in the future could be expanded to deploying/uninstalling/redeploying across an entire cluster.
Due to the use of JMX, there will not be an active connection from the management node to the server nodes at all times, and will instead be an on-demand connection that will be used only when control or information is requested, resulting in little network overhead.
Management Plugin Architecture
The management plugin resides on the management node, and serves as the user interface for requesting, processing, and then displaying statistical information from the server node(s), as well as providing an interface for a significant degree of control over them, including
- Server group management
- Deploy/undeploy across multiple, set attributes across multiple, start/stop/restart multiple
- Historical statistics view for 1-n servers
- Ability to custom-define statistics collection per-machine, per-group, across entire cluster
- Manipulate snapshot interval, retention period
- Enable/disable archiving, define archiving time/retention
Currently Implemented
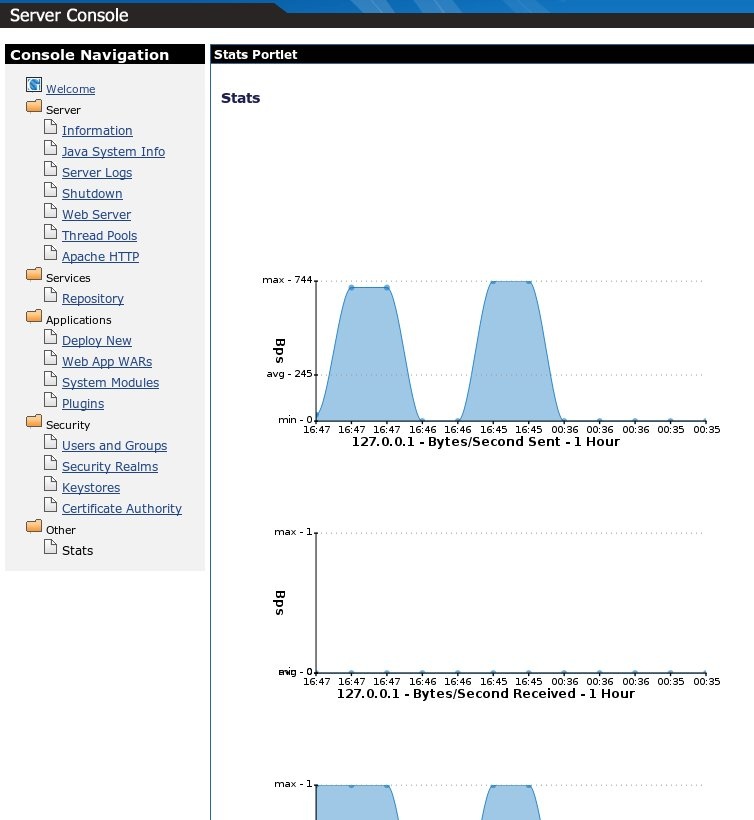
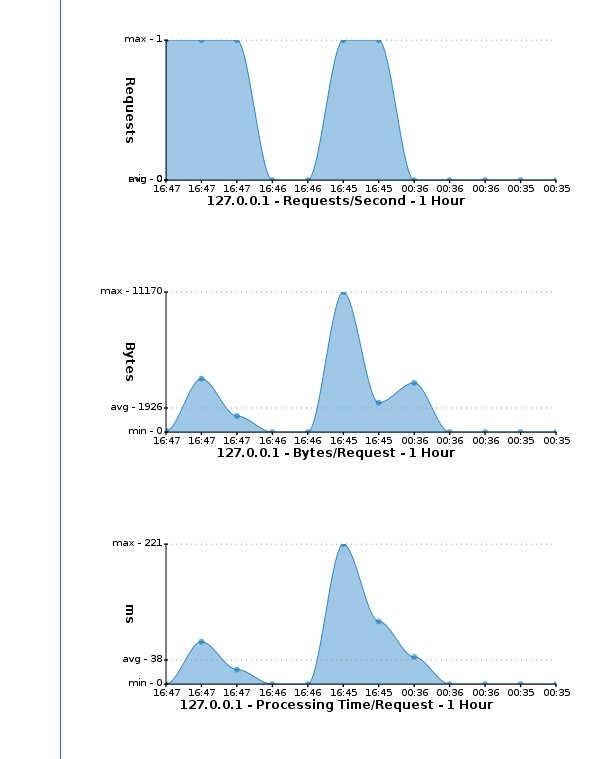
- Simple Tomcat statistics graph generation for localhost only - This is fully dynamic based on what is being collected on the server-side
- TomcatWebConnector
- Bytes/sec in
- TomcatWebConnector
-
-
- Bytes/sec out
-
-
-
- Requests/sec
-
-
-
- Errors/sec
-
-
-
- Bytes/Request
-
-
-
- Processing Time/Request
- TomcatWebSSLConnector
- Bytes/sec in
-
-
-
- Bytes/sec out
-
-
-
- Requests/sec
-
-
-
- Errors/sec
-
-
-
- Bytes/Request
-
-
-
- Processing Time/Request
- TomcatAJPConnector
- Bytes/sec in
-
-
-
- Bytes/sec out
-
-
-
- Requests/sec
-
-
-
- Errors/sec
-
-
-
- Bytes/Request
-
-
-
- Processing Time/Request
-
- Time frame able to be specified through arguments passed from the UI (JSP)
- Large portions of math and generation operations are done through javascript for a light load on the server
Current Dependencies
- Geronimo 2.1 Trunk
- Admin Console Plugin
- Pluto Plugin
- Dojo Plugin
Goals
- Implement configuration file on client side for customization of individual statistics and graphs
- Detect and indicate periods where collection thread was not running and 'dummy data' has been inserted in graph
- Improve user interface for ease of viewing/use
- Indicate a 'health' level through the colors of the graph, based on a percentage of the maximum for a specific value
- Implement ability to view multiple machines (not just localhost) through a config file
Remote Control Plugin Architecture
The RCP will reside on the Server Node and will be in charge of preparing information for the Management Node. Since there are many MBeans that the admin could potentially wish to track, we will use the MEJB class that is already implemented in Geronimo to contact these MBeans. 
The Master Controller will be the agent that will do the managerial tasks such as query the mbeans for their status. Additionally, the Master Controller will spawn a thread at the start of the server (or at deployment time) in order to keep an ongoing history of the server's status. The thread will stop and start with the GBean life-cycle of the RCP. Upon request, the Master Controller will gather all of the information (either by calling MEJB or looking into the server's history stored by the Snapshot XML Builder) and respond by shipping the data back to the Management Node.
Note: All stats will be JSR-77 compliant.
Taking snapshots
As of now, the RCP will spawn a thread, if it does not already exist, to capture the server's essential information. The thread will store the snapshot information on the server itself in the form of an XML. In order to preserve the history and not have a ridiculously large XML file, there will be a monthly archive of the server's information stored locally. The information stored in these XML files are what is passed on to the Management Plugin for further processing.
Currently Implemented
- Archive snapshots every month
- Return arbitrary number of snapshots' information
- Ability to start/stop snapshot thread
- Ability to specify the duration of time in between snapshots
- Ability to fetch JSR-77 stats
- Ability to modify mbean attributes
- Ability to add additional mbeans to keep track of in the snapshot process
- Ability to remove mbeans from the list that the snapshot process refers to to get take its snapshots
- JSR-77 stats for Tomcat Connectors and Jetty Containers are surfaced
Current Goals
- Take out unimplemented statistical numbers (e.g. activeRequestCount for Tomcat)
- Provide support for Jetty Connector stats (in Geronimo's code-base)
- Provide interface to add/remote/update servers controlled and monitored
- Provide ability to control the stopping/starting of components within server using StateManageable Objects (SMO).
- Upgrade portlet to be compatible with the new Pluggable Administration Console.
- Design a good way to enumerate all existing MBeans available on the Server Nodes for the Management Plugin.
Current Concerns
- Security of the JMX connection information residing on the Connection Information DB
- Security of MEJB
Screenshots