The Setup
When you add a new data source to Metron, the first step is to decide how to push the events from the new telemetry data source into Metron. You can use a number of data collection tools and that decision is decoupled from Metron. An excellent tool for pushing data into Metron is Apache NiFi which this section will describe how to use. The second step is to configure Metron to parse the telemetry data source so that downstream processing can be done on it. In this article we will walk you through how to perform both of these steps.
In the previous section, Setting up the Use Case, we described the following set of requirements for Customer Foo who wanted to add the Squid telemetry data source into Metron.
- The proxy events from the Squid logs need to be ingested in real-time.
- The proxy logs must be parsed into a standardized JSON structure that Metron can understand.
- In real-time, the Squid proxy event must be enriched so that the domain names are enriched with the IP information.
- In real-time, the IP within the proxy event must be checked for threat intel feeds.
- If there is a threat intel hit, an alert must be raised.
- The end user must be able to see the new telemetry events and the alerts from the new data source.
- All of these requirements must be implemented easily without writing any new Java code.
In this article, we will walk you through how to perform steps 1, 2, and 6.
Install Metron First
You will need to install Metron first. Today, there are three options to install Metron: Metron Installation Options. The following instructions should be applicable to all three install options given the following variables that you will need to plug in with your own values:
- KAFKA_HOST = The host where a Kafka broker is installed.
- ZOOKEEPER_HOST = The host where a Zookeeper server is installed.
- PROBE_HOST = The host where your sensor, probes are installed. If don't have any sensors installed, pick the host where a Storm supervisor is running.
- SQUID_HOST = The host where you want to install SQUID. If you don't care, just install SQUID on the PROBE_HOST.
- NIFI_HOST = Host where you will install NIFI. You want this this to be same host on which you installed Squid.
- HOST_WITH_ENRICHMENT_TAG = The host in your inventory hosts file that you put under the group "enrichment."
- SEARCH_HOST = The host where you have Elastic or Solr running. This is the host in your inventory hosts file that you put under the group "search". Pick one of the search hosts.
- SEARCH_HOST_PORT = The port of the search host where indexing is configured. (e.g., 9300)
- METRON_UI_HOST = The host where your Metron UI web application is running. This is the host in your inventory hosts file that you put under the group "web."
- METRON_VERSION = The release of the Metron binaries you are working with. (e.g., 0.2.0BETA-RC2)
Parsing the Squid Telemetry Data Source in Metron
The following steps guide you through how to add this new telemetry.
Step 1: Install the Squid Sensor
- ssh into $SQUID_HOST
- Install and start Squid:
sudo yum install squid
sudo service squid start
- With Squid started, look at the different log files that get created:
sudo su -
cd /var/log/squid
ls
You see that there are three types of logs available: access.log, cache.log, and squid.out. We are interested in access.log because that is the log that records the proxy usage.
- Initially the access.log is empty. Let's generate a few entries for the log, then list the new contents of the access.log. The "-h 127.0.0.1" indicates that the squidclient will only use the IPV4 interface.
squidclient -h 127.0.0.1 "http://www.aliexpress.com/af/shoes.html?ltype=wholesale&d=y&origin=n&isViewCP=y&catId=0&initiative_id=SB_20160622082445&SearchText=shoes"
squidclient -h 127.0.0.1 "http://www.help.1and1.co.uk/domains-c40986/transfer-domains-c79878"
squidclient -h 127.0.0.1 "http://www.pravda.ru/science/"
squidclient -h 127.0.0.1 "http://www.brightsideofthesun.com/2016/6/25/12027078/anatomy-of-a-deal-phoenix-suns-pick-bender-chriss"
squidclient -h 127.0.0.1 "https://www.microsoftstore.com/store/msusa/en_US/pdp/Microsoft-Band-2-Charging-Stand/productID.329506400"
squidclient -h 127.0.0.1 "https://tfl.gov.uk/plan-a-journey/"
squidclient -h 127.0.0.1 "https://www.facebook.com/Africa-Bike-Week-1550200608567001/"
squidclient -h 127.0.0.1 "http://www.ebay.com/itm/02-Infiniti-QX4-Rear-spoiler-Air-deflector-Nissan-Pathfinder-/172240020293?fits=Make%3AInfiniti%7CModel%3AQX4&hash=item281a4e2345:g:iMkAAOSwoBtW4Iwx&vxp=mtr"
squidclient -h 127.0.0.1 "http://www.recruit.jp/corporate/english/company/index.html"
squidclient -h 127.0.0.1 "http://www.lada.ru/en/cars/4x4/3dv/about.html"
squidclient -h 127.0.0.1 "http://www.help.1and1.co.uk/domains-c40986/transfer-domains-c79878"
squidclient -h 127.0.0.1 "http://www.aliexpress.com/af/shoes.html?ltype=wholesale&d=y&origin=n&isViewCP=y&catId=0&initiative_id=SB_20160622082445&SearchText=shoes"In production environments you would configure your users web browsers to point to the proxy server. But for the sake of simplicity of this tutorial, we will use the client that is packaged with the Squid installation. After we use the client to simulate proxy requests, the Squid log entries should look as follows:
1467011157.401 415 127.0.0.1 TCP_MISS/200 337891 GEThttp://www.aliexpress.com/af/shoes.html? - DIRECT/207.109.73.154 text/html
1467011158.083 671 127.0.0.1 TCP_MISS/200 41846 GEThttp://www.help.1and1.co.uk/domains-c40986/transfer-domains-c79878 - DIRECT/212.227.34.3 text/html
1467011159.978 1893 127.0.0.1 TCP_MISS/200 153925 GEThttp://www.pravda.ru/science/ - DIRECT/185.103.135.90 text/html - Using the Squid log entries, we can determine the format of the log entries which is:
timestamp | time elapsed | remotehost | code/status | bytes | method | URL rfc931 peerstatus/peerhost | type
Step 2: Create a Kafka Topic for the New Data Source
- Log into KAFKA_HOST as root.
Create a Kafka topic called squid.
/usr/hdp/current/kafka-broker/bin/kafka-topics.sh --zookeeper $ZOOKEEPER_HOST:2181 --create --topic squid --partitions 1 --replication-factor 1
- List all of the Kafka topics to ensure that the new topic exists.
/usr/hdp/current/kafka-broker/bin/kafka-topics.sh --zookeeper $ZOOKEEPER_HOST:2181 --list
You should see the following list of Kafka topics:
bro
enrichment
pcap
snort
squid
yaf
Step 3: Create a Grok Statement to Parse the Squid Telemetry Event
Now we are ready to tackle the Metron parsing topology setup.
- The first thing we need to do is decide if we will be using the Java-based parser or the Grok-based parser for the new telemetry. In this example we will be using the Grok parser. Grok parser is perfect for structured or semi-structured logs that are well understood (check) and telemetries with lower volumes of traffic (check).
- Next we need to define the Grok expression for our log. Refer to Grok documentation for additional details. In our case the pattern is:
SQUID_DELIMITED %{NUMBER:timestamp}.*%{INT:elapsed} %{IP:ip_src_address} %{WORD:action}/%{NUMBER:code} %{NUMBER:bytes} %{WORD:method} %{NOTSPACE:url}.*%{IP:ip_dst_addr}
If you do not want to include any part of the message in the resulting JSON structure, you can apply the UNWANTED tag to that section.
Finally, notice that we applied the naming convention to the IPV4 field by referencing the following list of field conventions.
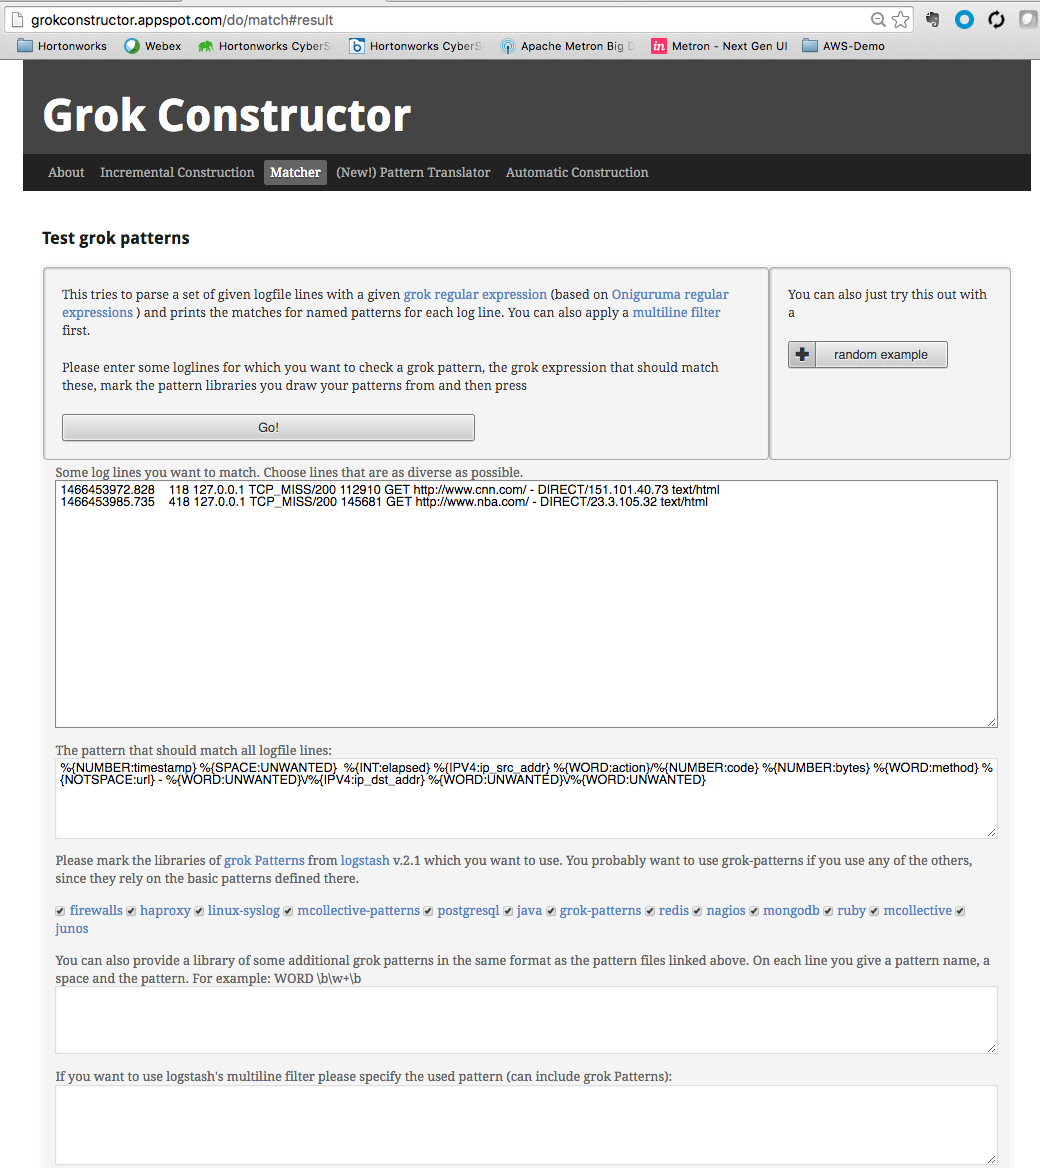
- The last thing we need to do is to validate the Grok pattern to make sure it's valid. For our test we will be using a free Grok validator called Grok Constructor. A validated Grok expression should look like this:

- Now that the Grok pattern has been defined, we need to save it and move it to HDFS.
- ssh into HOST $HOST_WITH_ENRICHMENT_TAG as root.
Create a file called "squid" in the tmp directory and copy the Grok pattern into the file.
touch /tmp/squid
- Open the Squid file and add the Grok pattern defined above.
Put the Squid file into the directory where Metron stores its Grok parsers. Existing Grok parsers that ship with Metron are staged under /apps/metron/pattern.
su - hdfshadoop fs -rm -r /apps/metron/patterns/squid
hdfs dfs -put /tmp/squid /apps/metron/patterns/
Step 4: Parse and Transform the Squid Message
Now that the Grok pattern is staged in HDFS, we need to define a parser configuration for the Metron Parsing Topology. The configurations are kept in Zookeeper so the sensor configuration must be uploaded there after it has been created.
- ssh into Host $HOST_WITH_ENRICHMENT_TAG as root.
- Create a Squid Grok parser configuration file at /usr/metron/$METRON_VERSION/config/zookeeper/parsers/squid.json:
touch /usr/metron/$METRON_VERSION/config/zookeeper/parsers/squid.json
- Add the following contents:
{
 "parserClassName": "org.apache.metron.parsers.GrokParser",
 "sensorTopic": "squid",
 "parserConfig": {
 "grokPath": "/apps/metron/patterns/squid",
 "patternLabel": "SQUID_DELIMITED",
 "timestampField": "timestamp"
 },
 "fieldTransformations" : [
   {
     "transformation" : "STELLAR"
    ,"output" : [ "full_hostname", "domain_without_subdomains" ]
    ,"config" : {
                  "full_hostname" : "URL_TO_HOST(url)"
                 ,"domain_without_subdomains" : "DOMAIN_REMOVE_SUBDOMAINS(full_hostname)"
                }
    }
  ]
}
Notice the use of the fieldTransformations in the parser configuration. Our Grok Parser is set up to extract the URL, but really we want just the domain or even the domain without subdomains. To do this, we can use the Metron Transformation Language field transformation. The Metron Transformation Language is a Domain Specific Language that allows users to define extra transformations to be done on the messages flowing through the topology. It supports a wide range of common network and string-related functions as well as function composition and list operations. In our case, we extract the hostname from the URL via the URL_TO_HOST function and remove the domain names with DOMAIN_REMOVE_SUBDOMAINS thereby creating two new fields, "full_hostname" and "domain_without_subdomains" to each message.
All parser configurations are stored in Zookeeper. Use the following script to upload configurations to Zookeeper:
/usr/metron/$METRON_VERSION/bin/zk_load_configs.sh --mode PUSH -i /usr/metron/$METRON_VERSION/config/zookeeper -z $ZOOKEEPER_HOST:2181
Note: You might receive the following warning messages when you execute the previous command. You can safely ignore these warning messages.
log4j:WARN No appenders could be found for logger (org.apache.curator.framework.imps.CuratorFrameworkImpl).
log4j:WARN Please initialize the log4j system properly.
log4j:WARN See http://logging.apache.org/log4j/1.2/faq.html#noconfig for more info.
Step 5: Configure Indexing
Next you might want to configure your sensor's indexing. The indexing topology takes the data from a topology that has been enriched and stores the data in one or more supported indices.
You can choose not to configure a sensor's indexing and use the default values. If you leave the writer configuration unspecified, you will see a warning similar to the following in the Storm console: WARNING: Default and (likely) unoptimized writer config used for hdfs writer and sensor squid. You can ignore this warning message if you intend to use the default configuration.
To configure a sensor's indexing:
1. Create a file called squid.json at /usr/metron/$METRON_VERSION/config/zookeeper/indexing/:
touch $METRON_HOME/config/zookeeper/indexing/squid.json
2. Populate it with the following:
  {
    "elasticsearch": {
       "index": "squid",
       "batchSize": 5,
   "enabled" : true
    },
    "hdfs":{
 "index": "squid",
   "batchSize": 5,
       "enabled" : true
    }
}
This file sets the batch size of 5 and the index name to squid for both the Elasticsearch and HDFS writers.
3. Push the configuration to ZooKeeper:
/usr/metron/$METRON_VERSION/bin/zk_load_configs.sh --mode PUSH -i /usr/metron/$METRON_VERSION/config/zookeeper -z $ZOOKEEPER_HOST:2181
Step 6: Validate the Squid Message
- ssh into Host $HOST_WITH_ENRICHMENT_TAG as root.
- Open up the global validation configuration.
- Open the /usr/metron/$METRON_VERSION/config/zookeeper/global.json or another text editing tool:
vi /usr/metron/$METRON_VERSION/config/zookeeper/global.json
- Add the following validation configuration to the file after the es configuration:
  "fieldValidations" : [
   {
      "input" : [ "ip_src_addr", "ip_dst_addr" ],
      "validation" : "IP",
      "config" : {
      "type" : "IPV4"
       }
   }
  ]
- Add the following validation configuration to the file after the es configuration:
Push the global configuration to Zookeeper:
/usr/metron/$METRON_VERSION/bin/zk_load_configs.sh -i /usr/metron/$METRON_VERSION/config/zookeeper -m PUSH -z $ZOOKEEPER_HOST:2181
Dump the configs and validate that were persisted:
/usr/metron/$METRON_VERSION/bin/zk_load_configs.sh -m DUMP -z $ZOOKEEPER_HOST:2181
Note: You might receive the following warning messages when you execute the previous command. You can safely ignore these warning messages.
log4j:WARN No appenders could be found for logger (org.apache.curator.framework.imps.CuratorFrameworkImpl).
log4j:WARN Please initialize the log4j system properly.
log4j:WARN See http://logging.apache.org/log4j/1.2/faq.html#noconfig for more info.
The below describes the validation configuration you see above.

More details on the validation framework can be found in the Validation Framework section: https://github.com/apache/incubator-metron/tree/master/metron-platform/metron-common#transformation-language
Step 7: Deploy the new Parser Topology
Log into HOST $HOST_WITH_ENRICHMENT_TAG as root.
- Deploy the new squid parser topology:
/usr/metron/$METRON_VERSION/bin/start_parser_topology.sh -k $KAFKA_HOST:6667 -z $ZOOKEEPER_HOST:2181 -s squid
- Go to the Storm UI. You should now see the new "squid" topology. Ensure that the topology has no errors.

Using Apache NiFi to Stream Data into Metron
Put simply NiFi was built to automate the flow of data between systems. Hence it is a fantastic tool to collect, ingest, and push data to Metron.
The following instructions define how to install configure and create the NiFi flow to push Squid events into Metron.
Install, Configure, and Start Apache NiFi
The following steps show how to install NiFi. Perform the following as root:
- ssh into HOST $NIFI_HOST as root.
- Download NiFi.
cd /usr/lib
wget  http://public-repo-1.hortonworks.com/HDF/centos6/1.x/updates/1.2.0.0/HDF-1.2.0.0-91.tar.gz
tar -zxvf HDF-1.2.0.0-91.tar.gz
- Edit the NiFi configuration to update the port of the NiFi web app: nifi.web.http.port=8089
cd HDF-1.2.0.0/nifi
vi  conf/nifi.properties
//update nifi.web.http.port to 8089
- Install NiFi as service.
bin/nifi.sh install nifi
- Start the NiFi Service.
service nifi start
- Go to the NiFi Web: http://$NIFI_HOST:8089/nifi/.
Note: Be sure to substitute your NiFi host name for $NIFI_HOST in the url above. If you simply click on the host, the url will specify Node1 which will not work.
Create a NiFi Flow to Stream Events to Metron
Now we will create a flow to capture events from Squid and push them into Metron.
- Drag a processor to the canvas (do this by the dragging the processor icon which is the first icon on the toolbar).
- Select the TailFile type of processor, then select Add.
- Right click on the processor and select Configure to display the Configure Processor dialog box. In the Settings tab change the name to "Ingest Squid Events"
- In the Properties tab, configure the following:

- In the Properties tab, configure the following:
- Drag another processor to the canvas.
- Select the PutKafka type of processor, then select Add.
- Right click on the processor and select Configure.
- In the Settings tab, change the name to "Stream to Metron,” then click the relationship checkboxes for failure and success.
- In the Properties tab, set the following three properties:
- Known Brokers: $KAFKA_HOST:6667
- Topic Name: squid
- Client Name: nifi-squid
- Create a connection by dragging the arrow from the Ingest Squid Events processor to the Stream to Metron processor.
- Press the Shift key and select the entire flow, then click the play button (green arrow). You should see all of the processor icons turn into green arrows like below:

- Generate some data using squidclient (do this for about 20+ sites).
squidclient -h 127.0.0.1 "http://www.cnn.com"
- You should see metrics on the processor of data being pushed into Metron.
- Look at the Storm UI for the parser topology and you should see tuples coming in.
- After about 5 minutes, you should see a new Elastic Search index called squid_index* in the Elastic Admin UI.
Verify Events are Indexed
By convention, the index where the new messages will be indexed is called squid_index_[timestamp] and the document type is squid_doc.
In order to verify that the messages were indexed correctly, we can use the elastic search Head plugin.
- ssh into Host $SEARCH_HOST.
- Install the head plugin:
usr/share/elasticsearch/bin/plugin install mobz/elasticsearch-head/1.x
- Navigate to elastic head UI: http://SEARCH_HOST:9200/_plugin/head/.
- Click on the Browser tab and select squid doc in the left panel, then select one of the sample docs. You should see something like the following:
